I recently had the opportunity to implement some new visualizations for Uber City Guides. Before launch, we discovered a strange bug that only occurred on Chrome for iOS. Even though there are some helpful guides online on how to debug Chrome specific bugs on iOS (like this) I couldn't find a comprehensive guide from start to finish, so I decided to create one.
Installation and Setup
-
Install RemoteDebug iOS WebKit Adapter on your OSX computer (Mac)
- This requires you to first install two dependencies using
brew(libimobiledevice and iOS WebKit Debug Proxy)$ brew update $ brew unlink libimobiledevice ios-webkit-debug-proxy usbmuxd $ brew uninstall --force libimobiledevice ios-webkit-debug-proxy usbmuxd $ brew install --HEAD usbmuxd $ brew install --HEAD libimobiledevice $ brew install --HEAD ios-webkit-debug-proxy - Then install RemoteDebug iOS WebKit Adapter globally:
or if you are experiencing issues$ npm install remotedebug-ios-webkit-adapter -g$ npm install remotedebug-ios-webkit-adapter@next -g
- This requires you to first install two dependencies using
-
Enable the Web Inspector on your iOS device (iPhone or iPad)
- Choose Settings > Safari > Advanced
- Toggle "Web Inspector" on
-
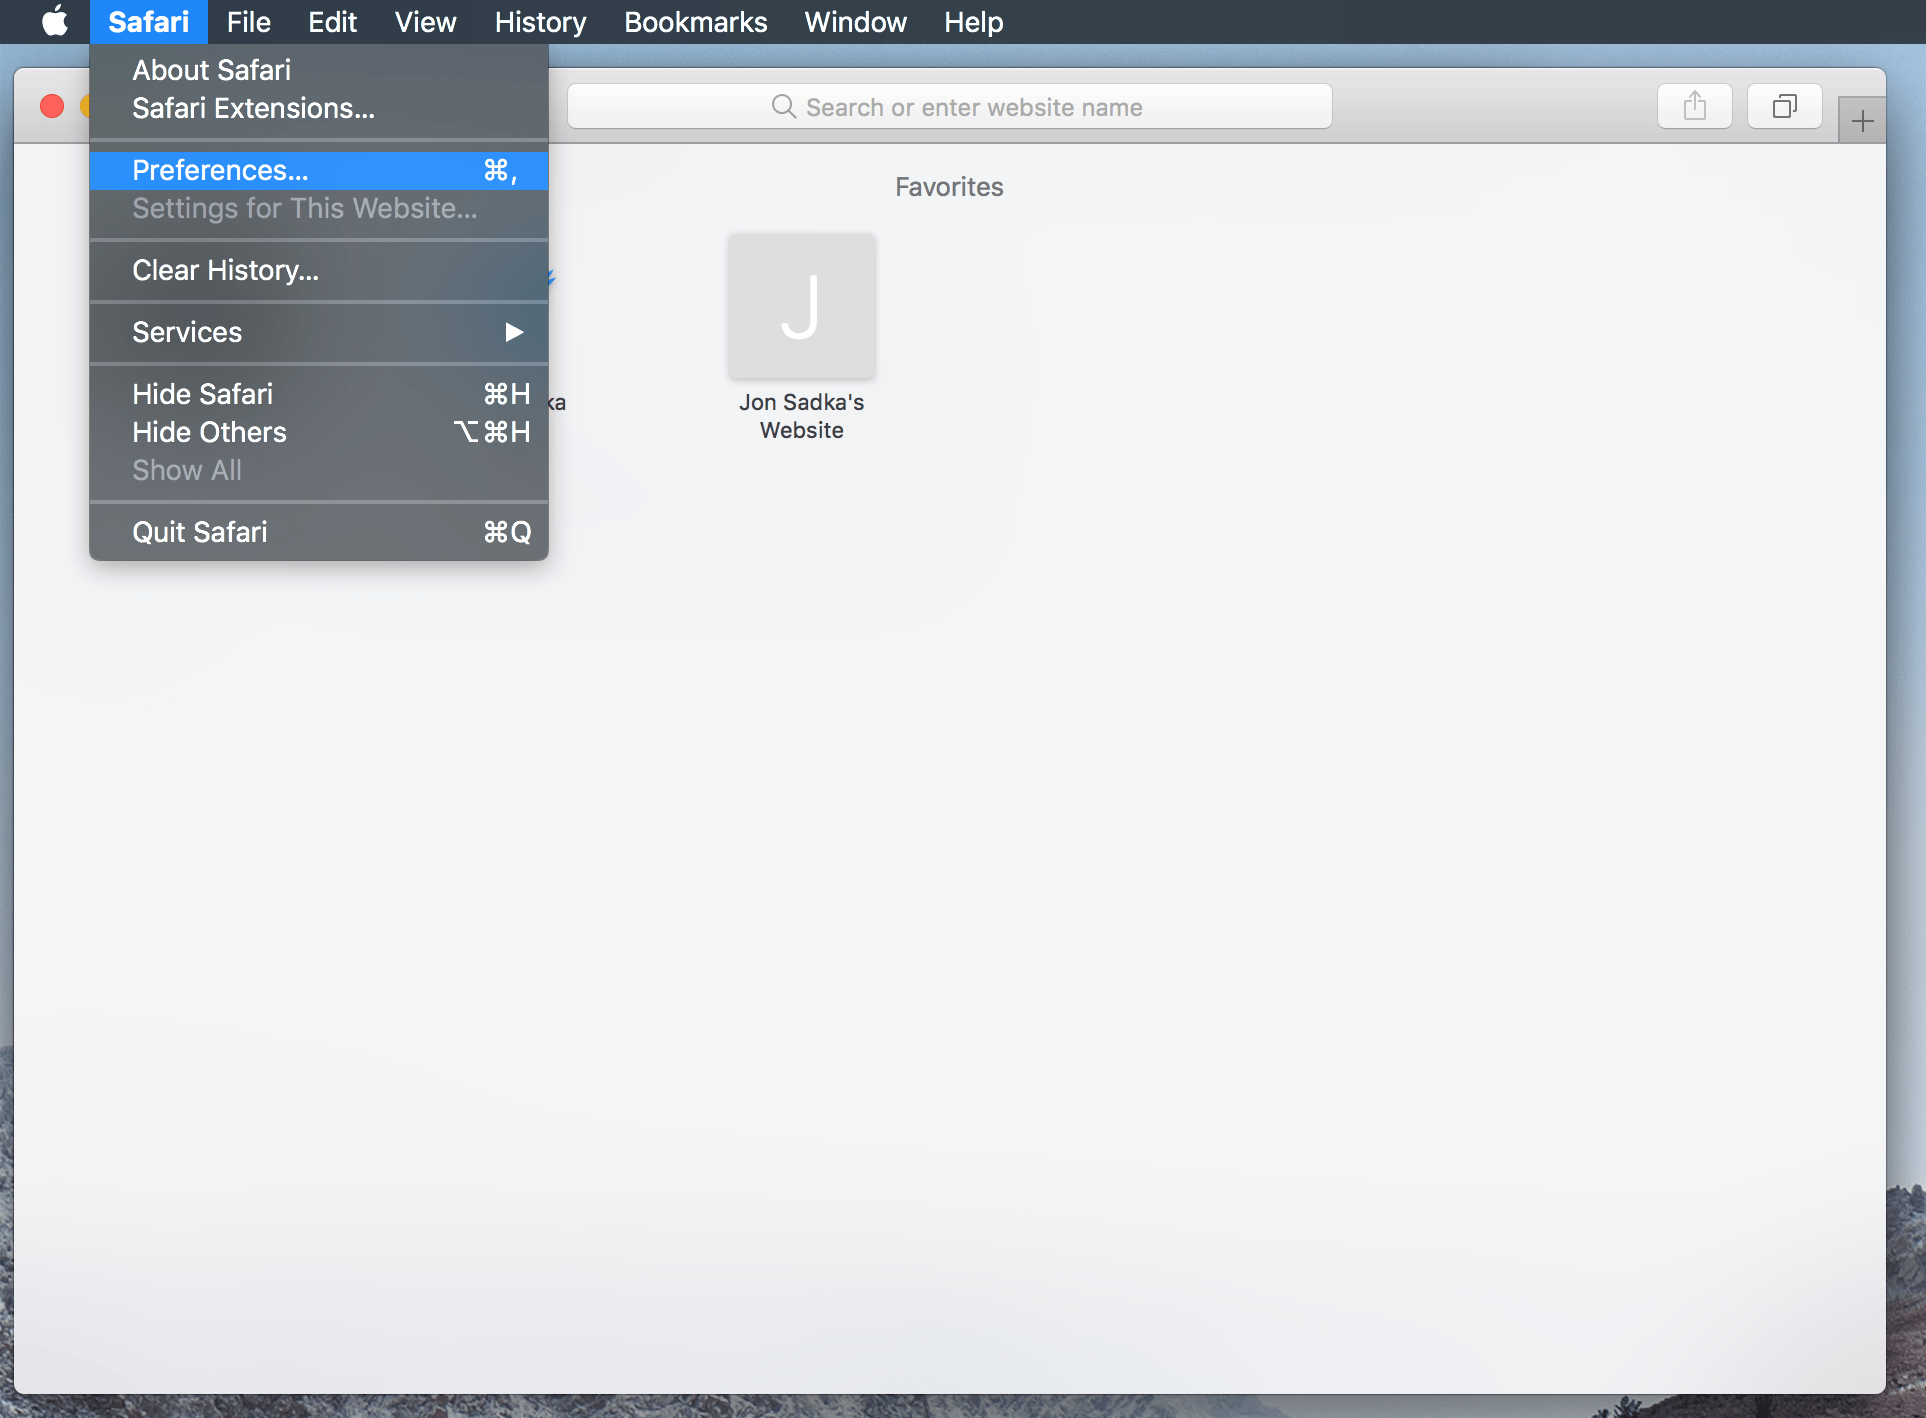
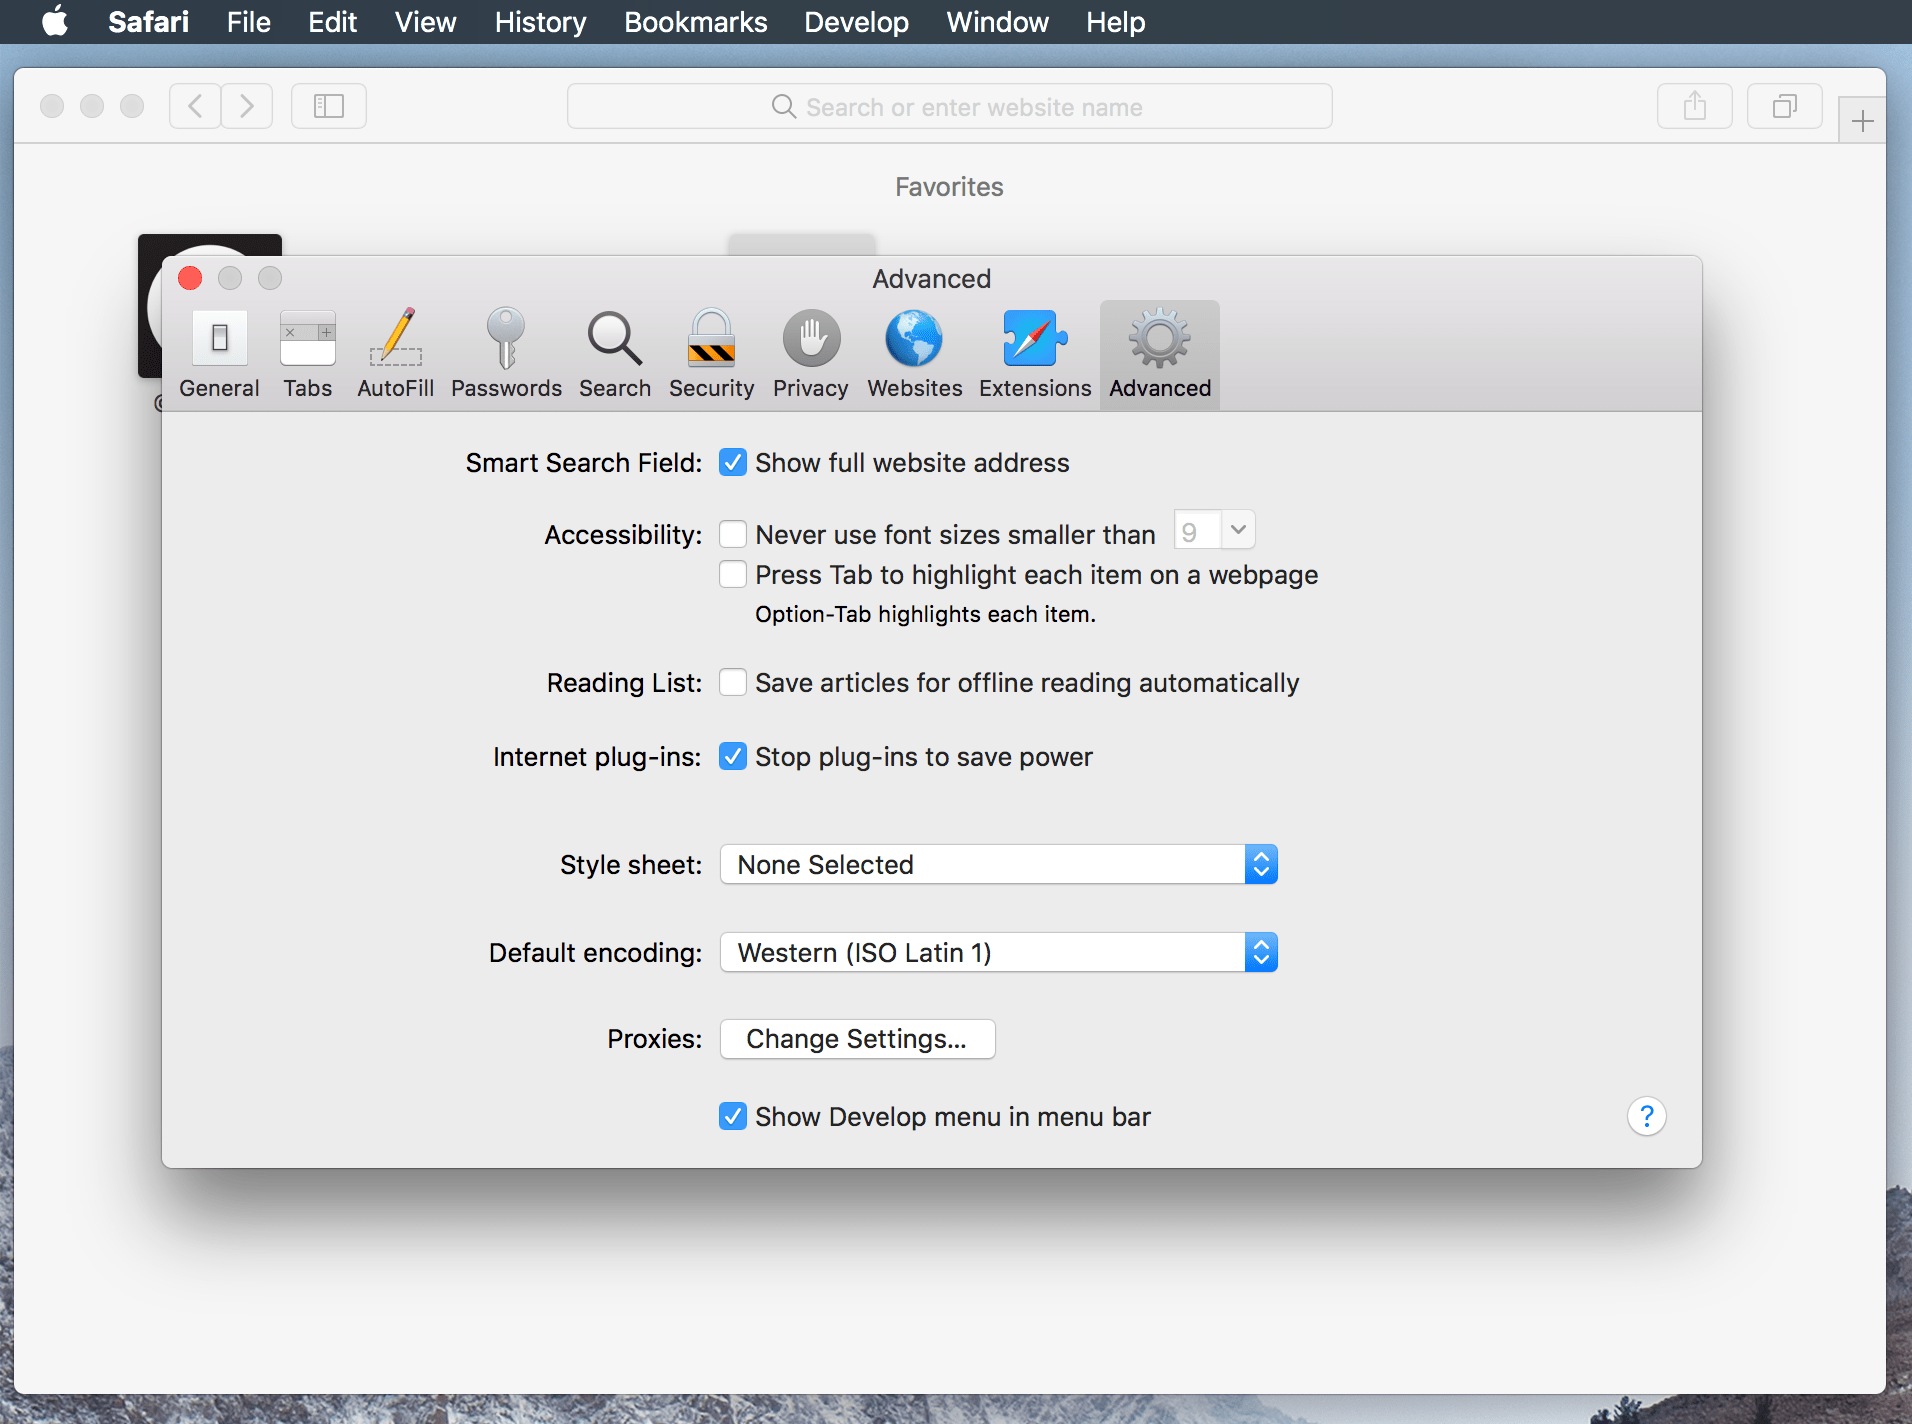
Enable the Develop Menu in Safari on your OSX computer (official link)
- Choose Safari > Preferences, and click Advanced
- At the bottom of the pane, select the "Show Develop menu in menu bar" checkbox.
-
Allow your OSX computer to access your iOS device
- Connect your iOS device to your OSX computer using your USB cable
- Open Safari on OSX
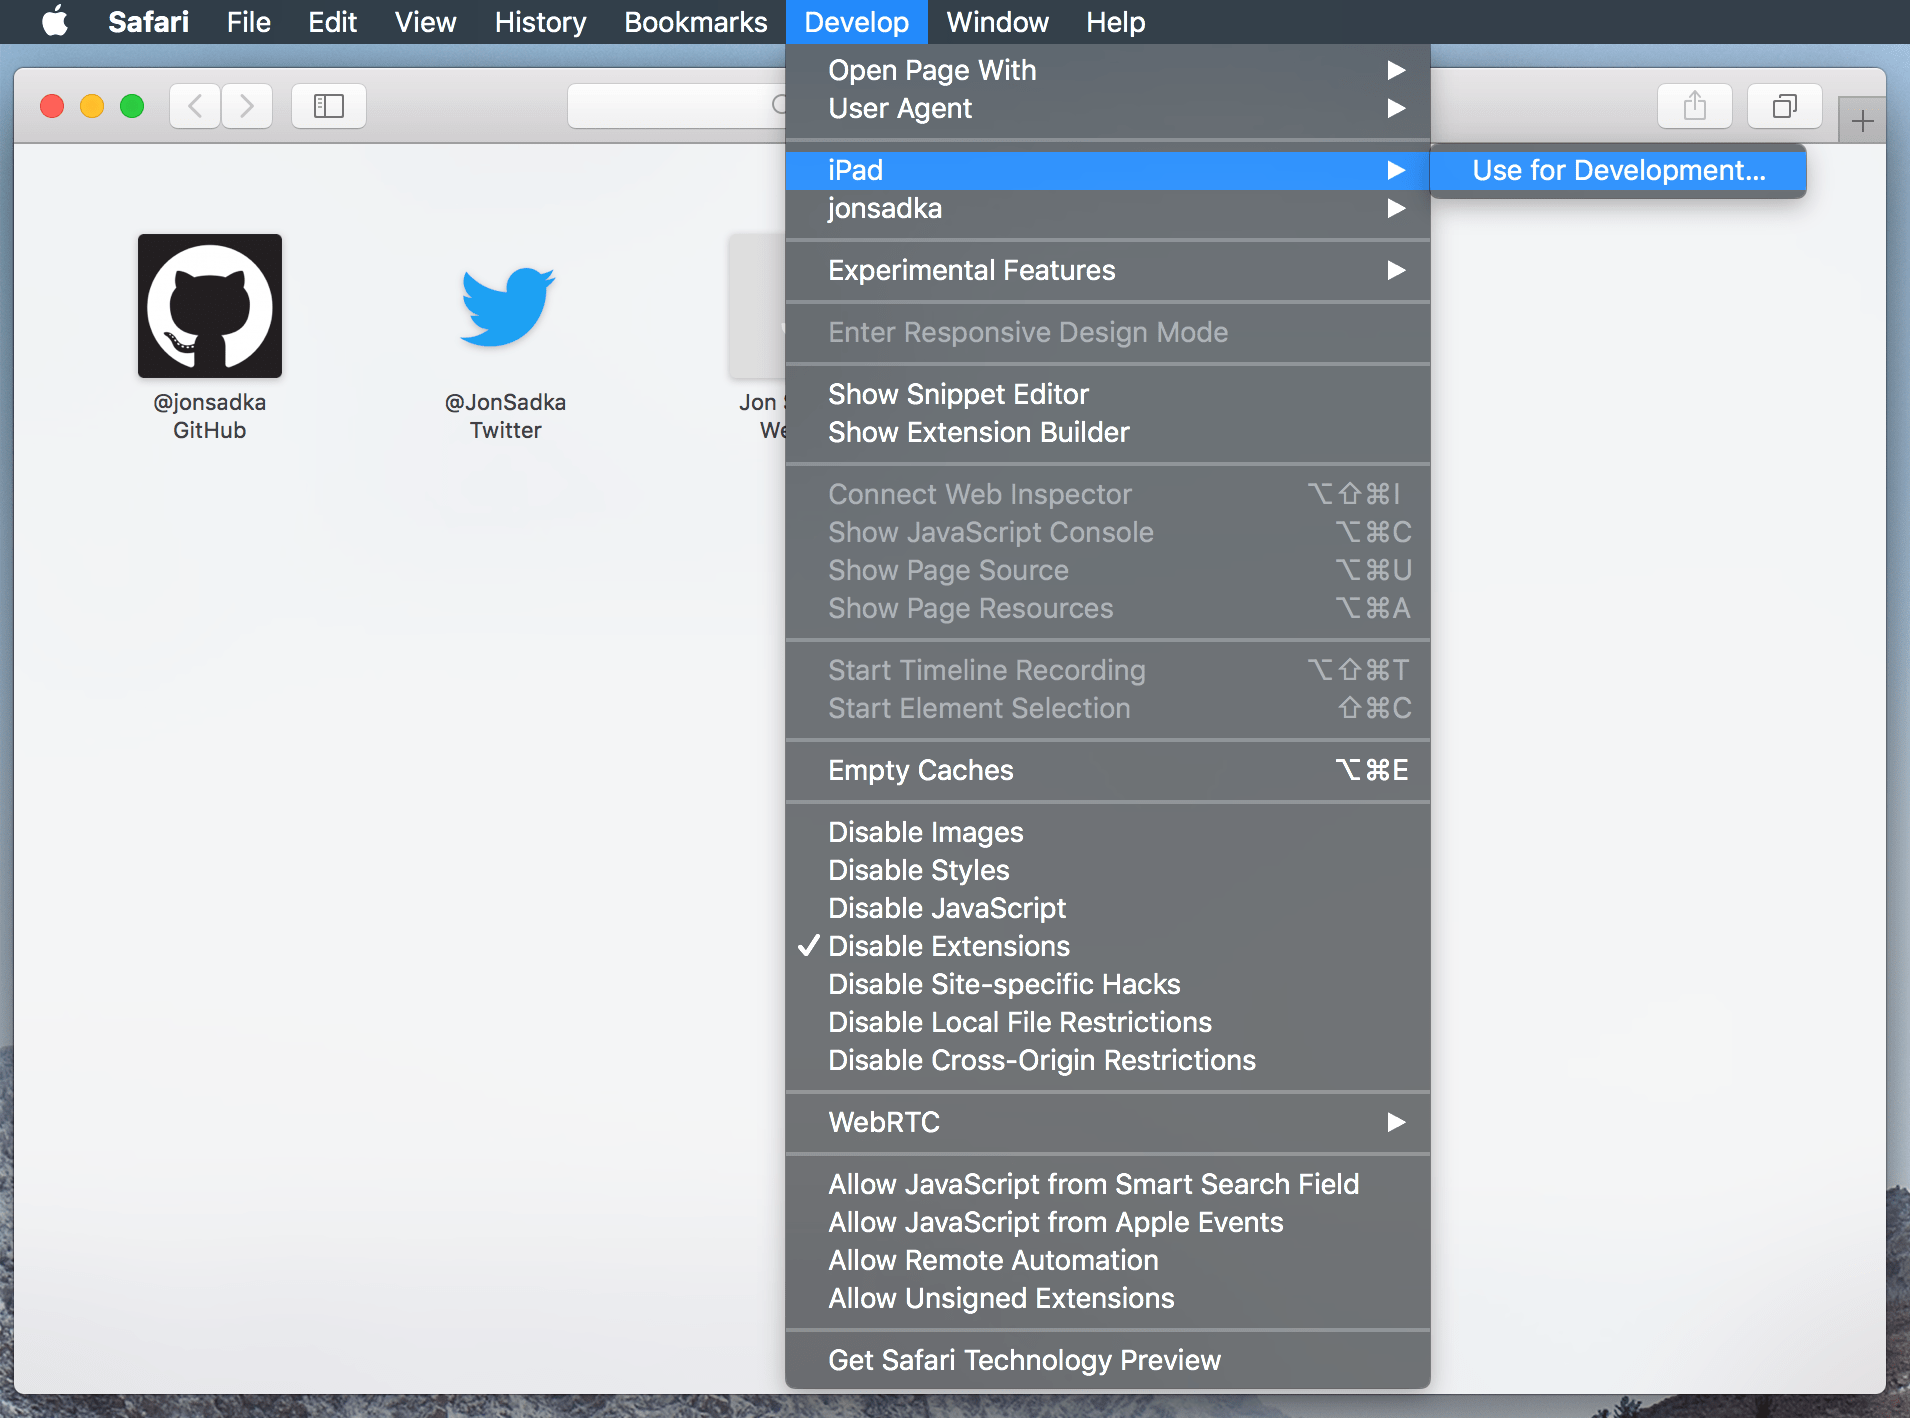
- Develop > Hover over your iOS device
- Click "Use for Development..."
- On your iOS device, click "Trust" when you see the "Trust this Computer?" prompt
-
Setup device discovery in Chrome on OSX
- Open Chrome on your OSX computer and navigate to
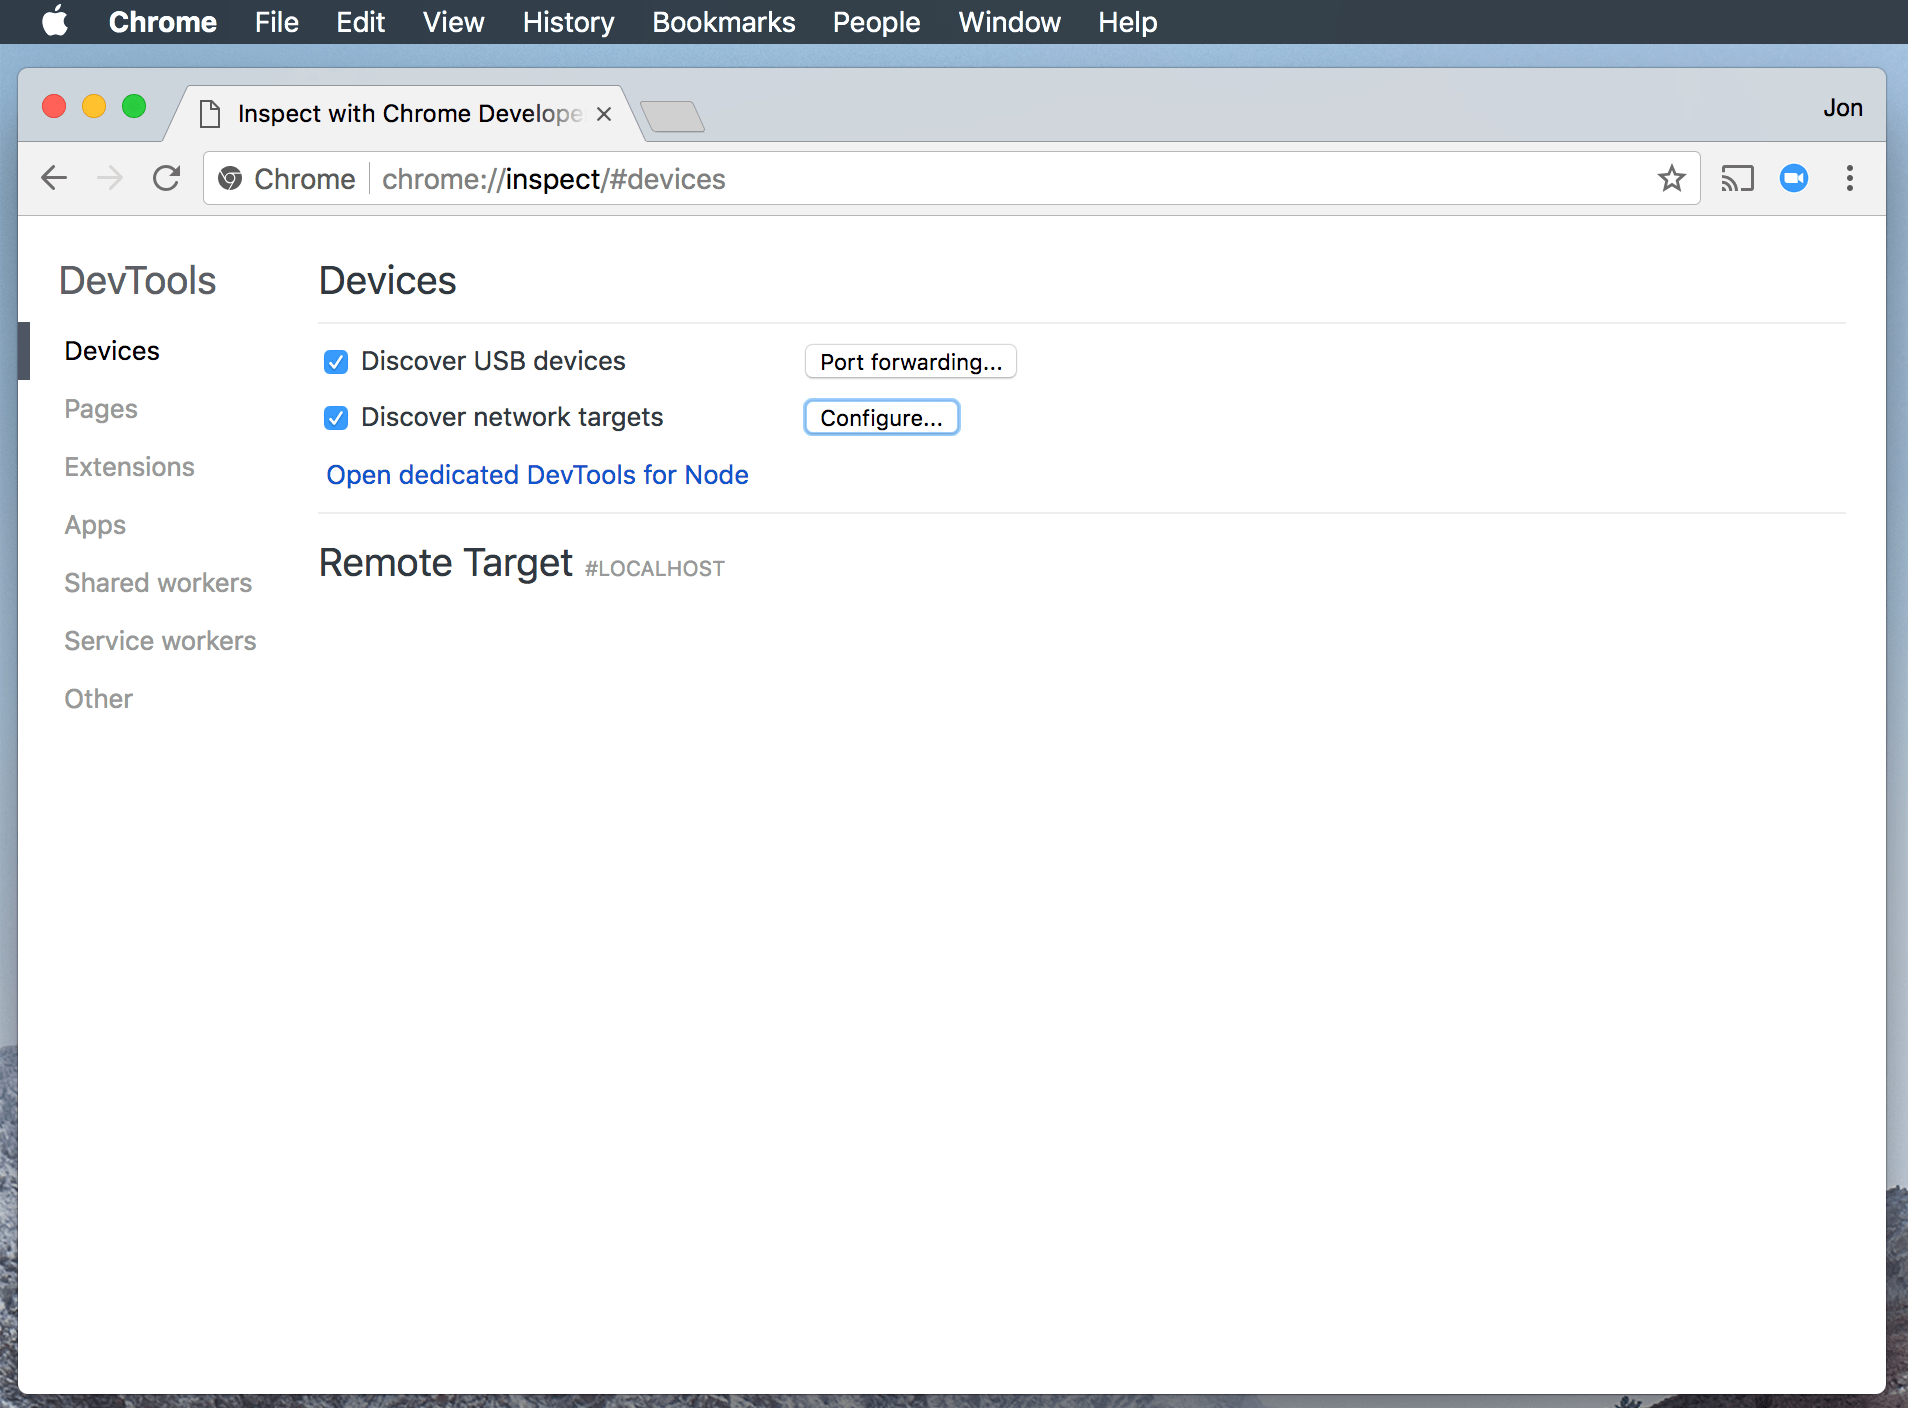
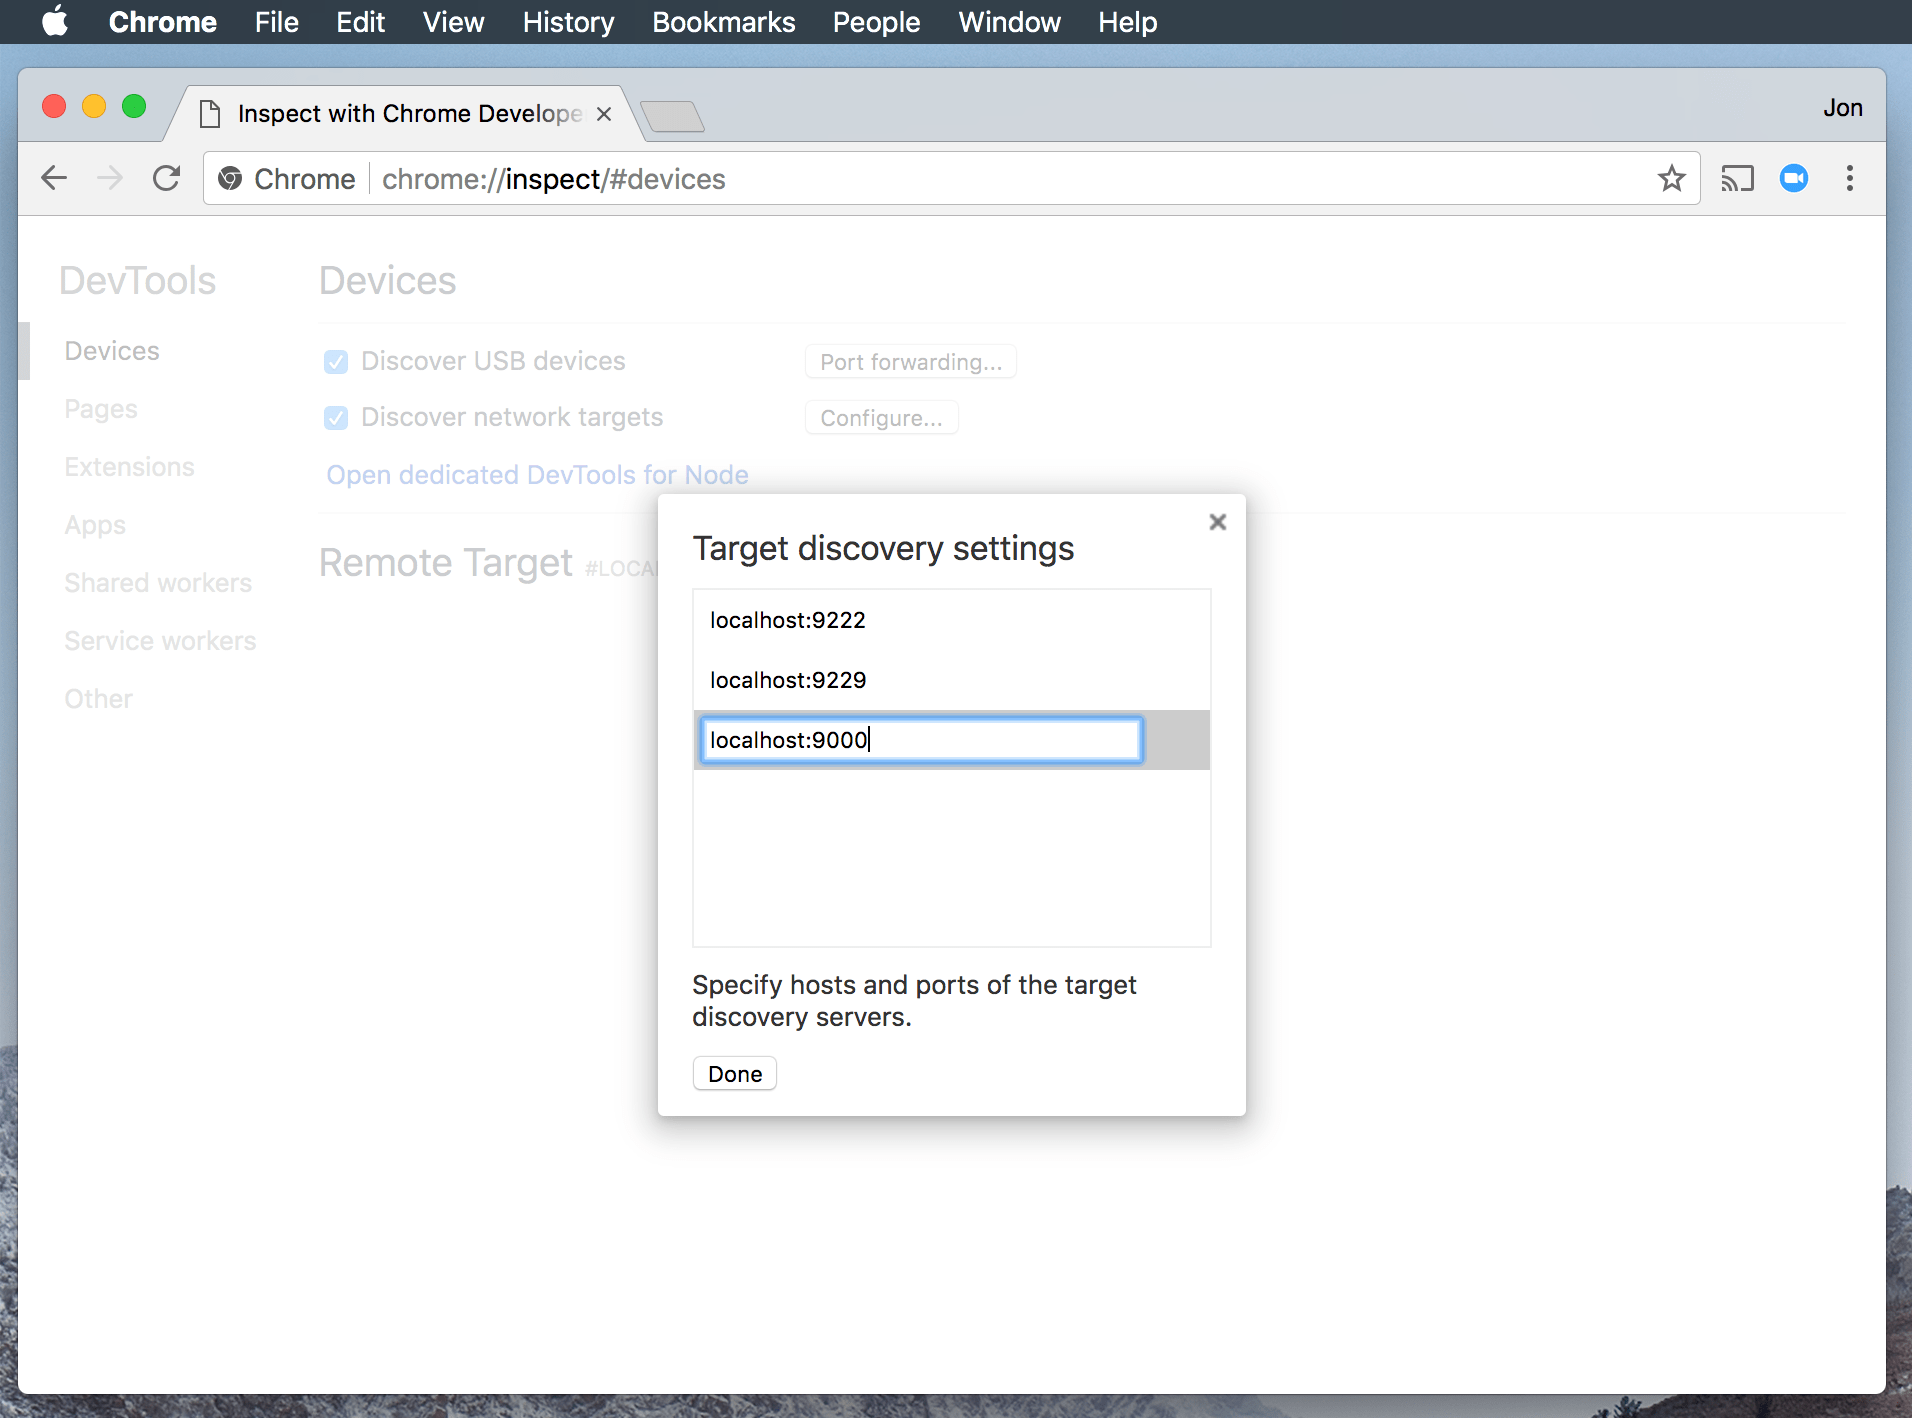
chrome://inspect/#devices - Select the "Discover network targets" checkbox and click the "Configure" button
- Add "localhost:9000" to the list of hosts
- Click "Done"
- Open Chrome on your OSX computer and navigate to
Debugging
-
[Optional if developing locally] Identify local server address
- Run your server locally on your OSX computer
- Identify the port your webpage is being served from (typically
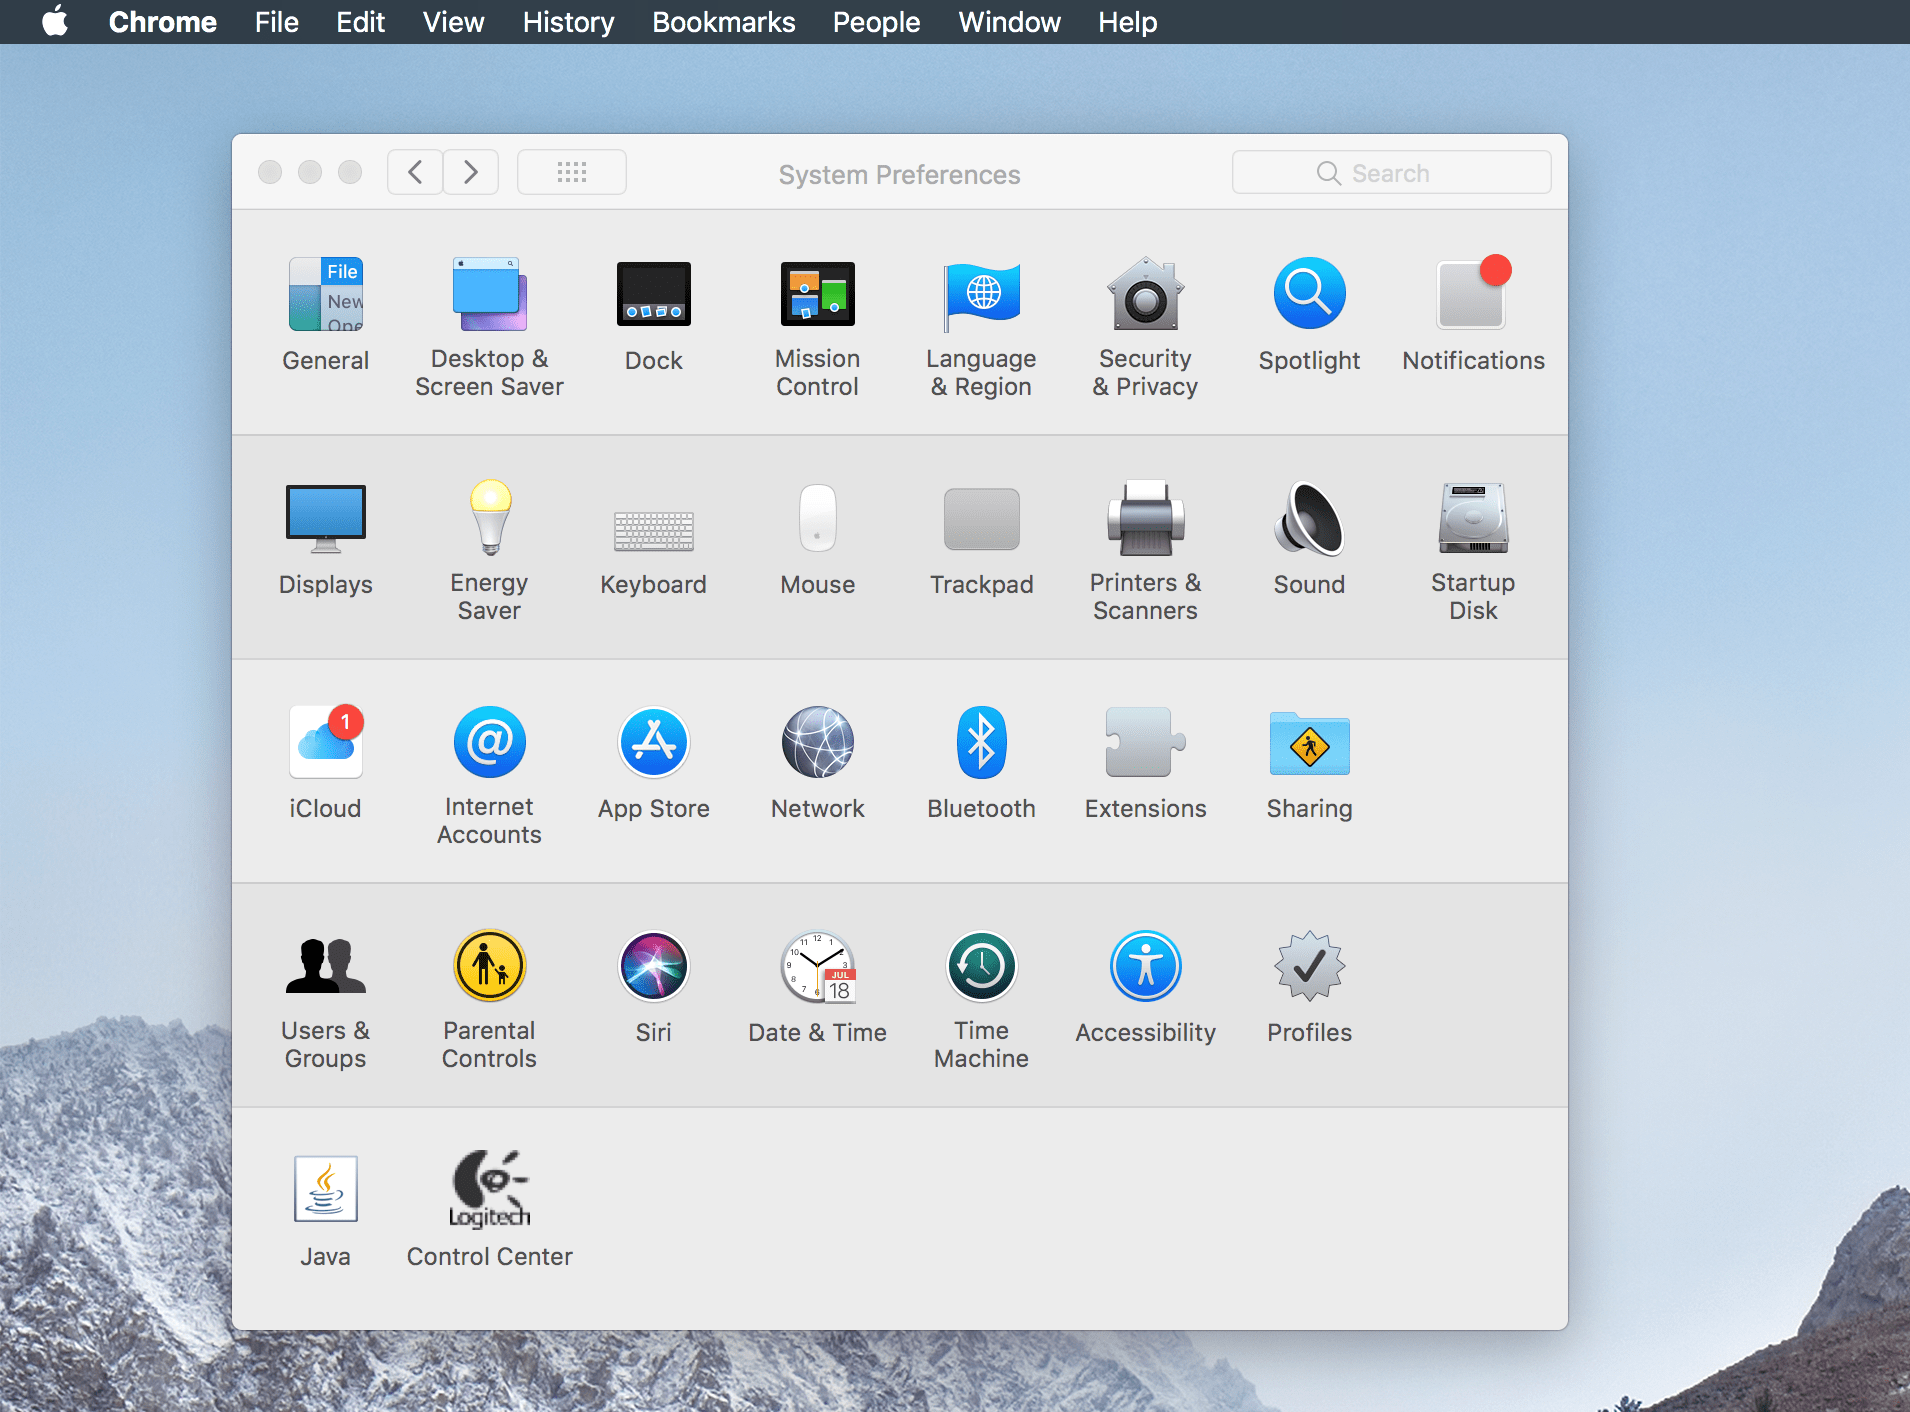
http://localhost:<port>) - Open System Preferences on OSX
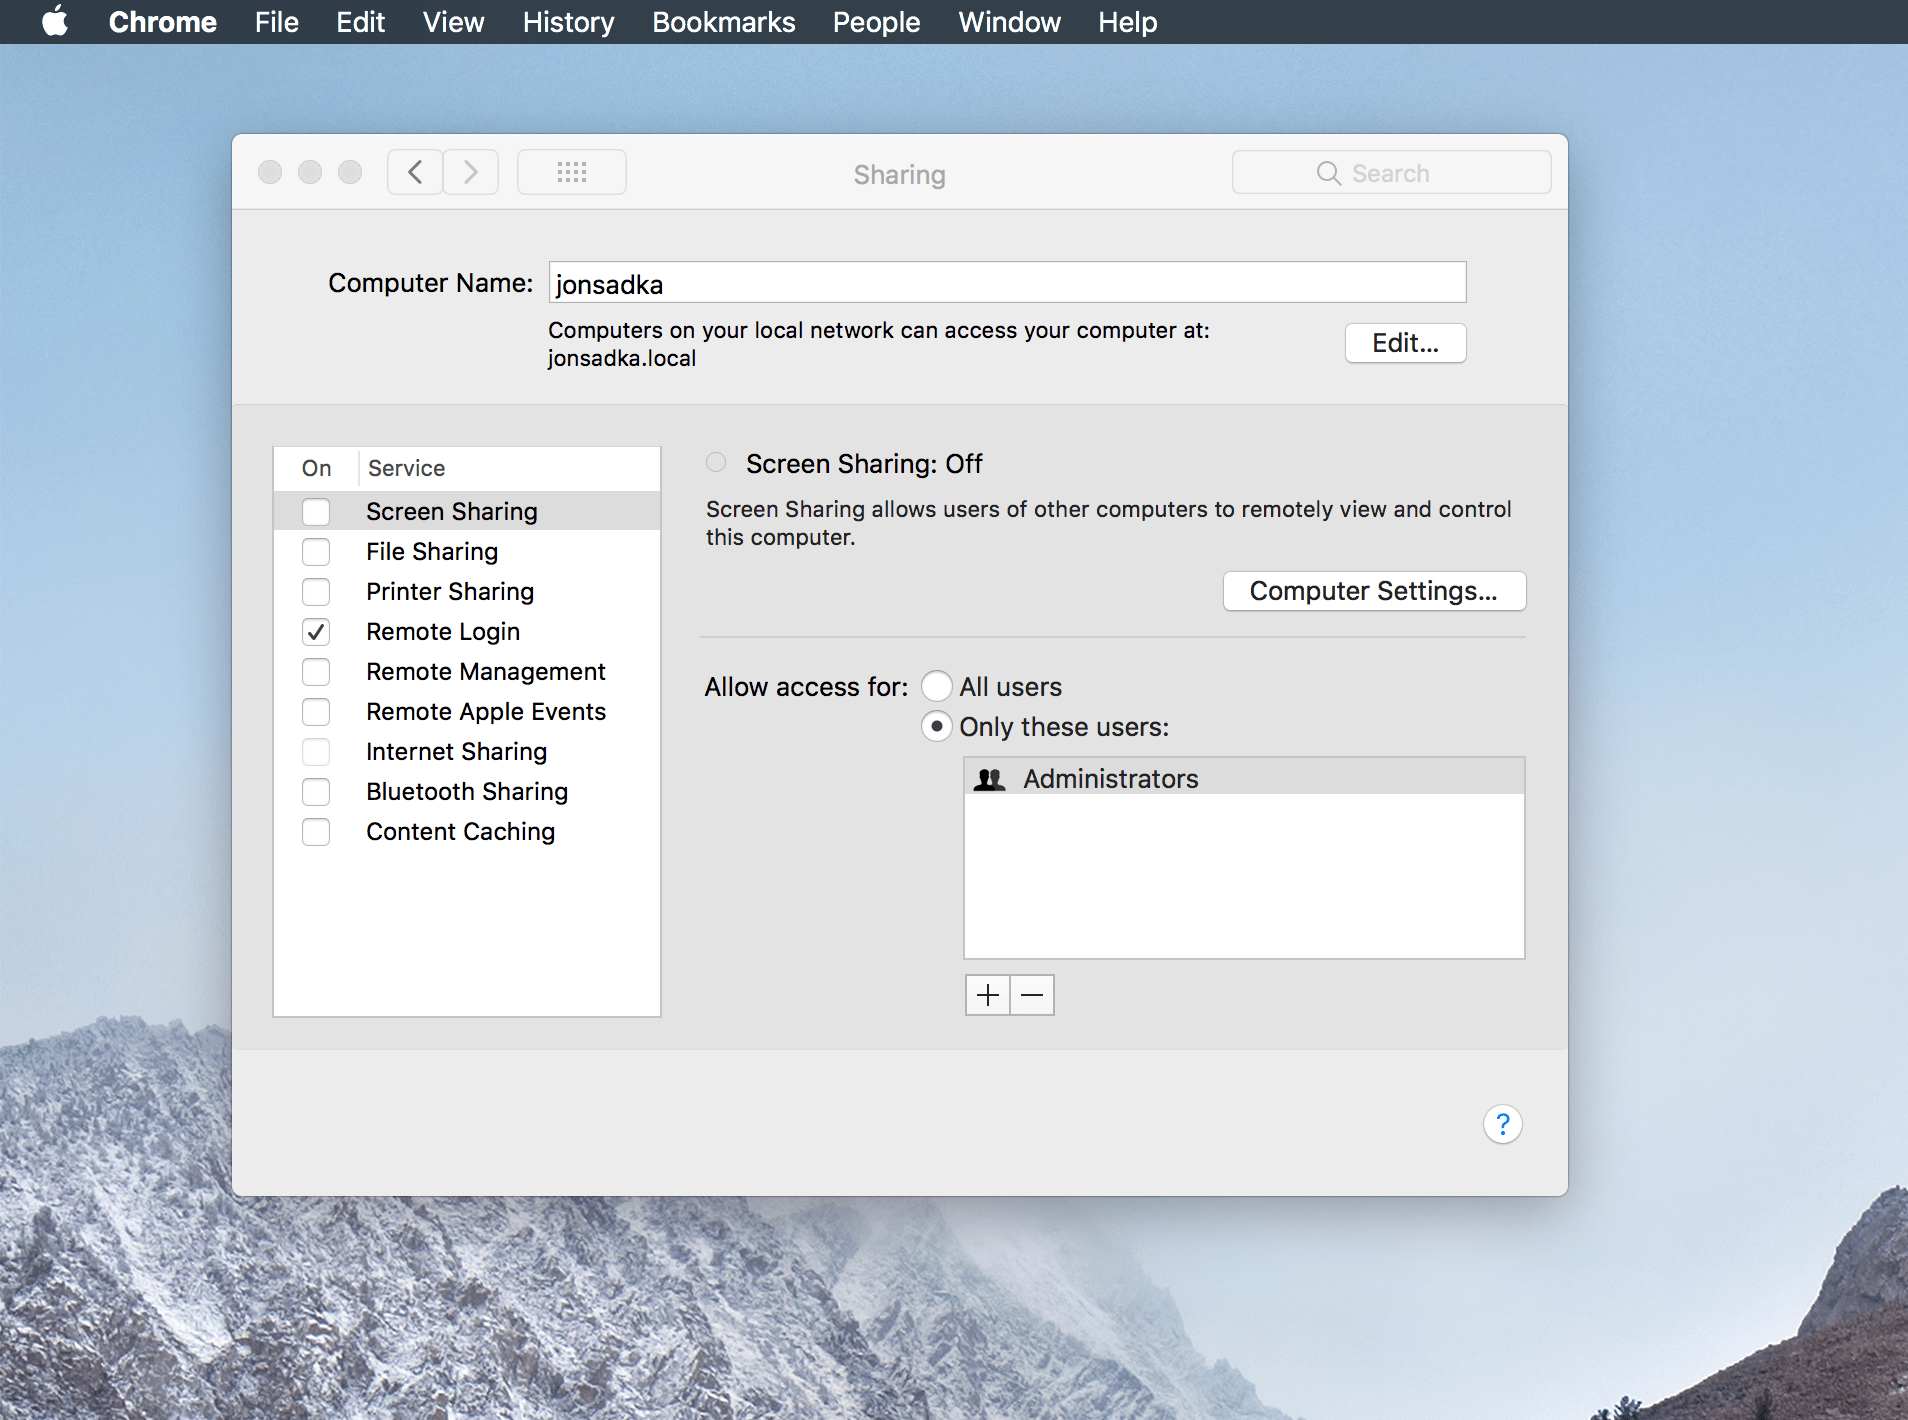
- Click "Sharing" and identify the computer name (typically
<computername>.local)
-
Load the webpage on your iOS device
- Make sure your iOS device is connected to your OSX computer using your USB cable
- On your iOS device, open Safari and navigate to the page you are trying to debug (i.e.
<websitename>.comor, for local development,http://<computername>.local:<port>) - NOTE: Even though we are loading up in Safari on our iOS device, remote debugging using Chrome on our OSX computer will use Chrome's context and user agent instead of Safari's)
-
Run the remote debugger on your OSX computer
$ remotedebug_ios_webkit_adapter --port=9000 -
Debug using Chrome
- Open Chrome on your OSX computer and navigate to
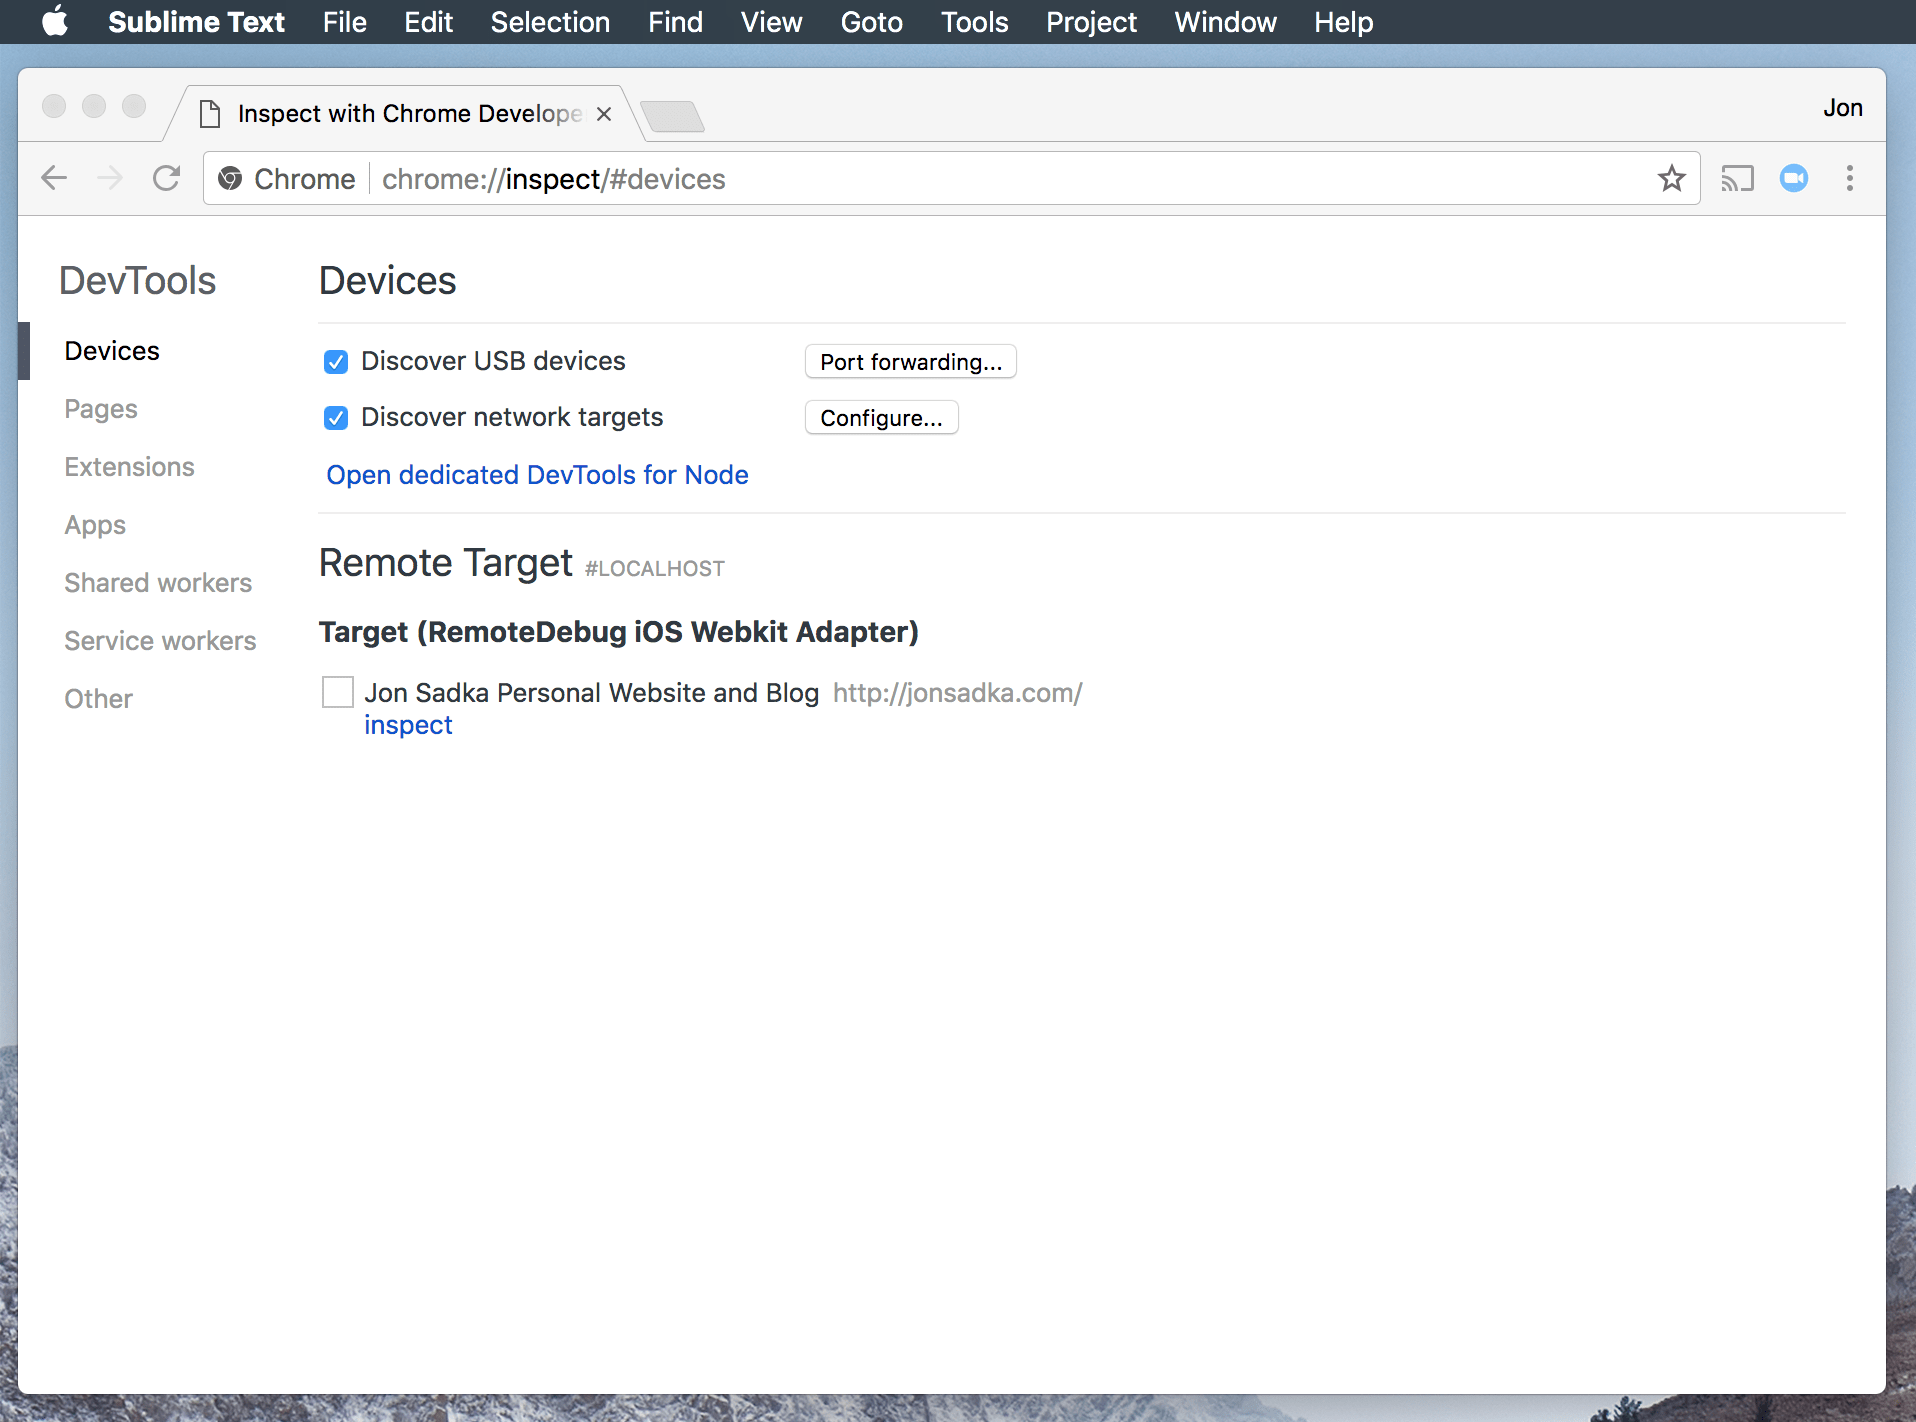
chrome://inspect/#devices - Identify the webpage you wish to debug on the iOS device and click "Inspect"
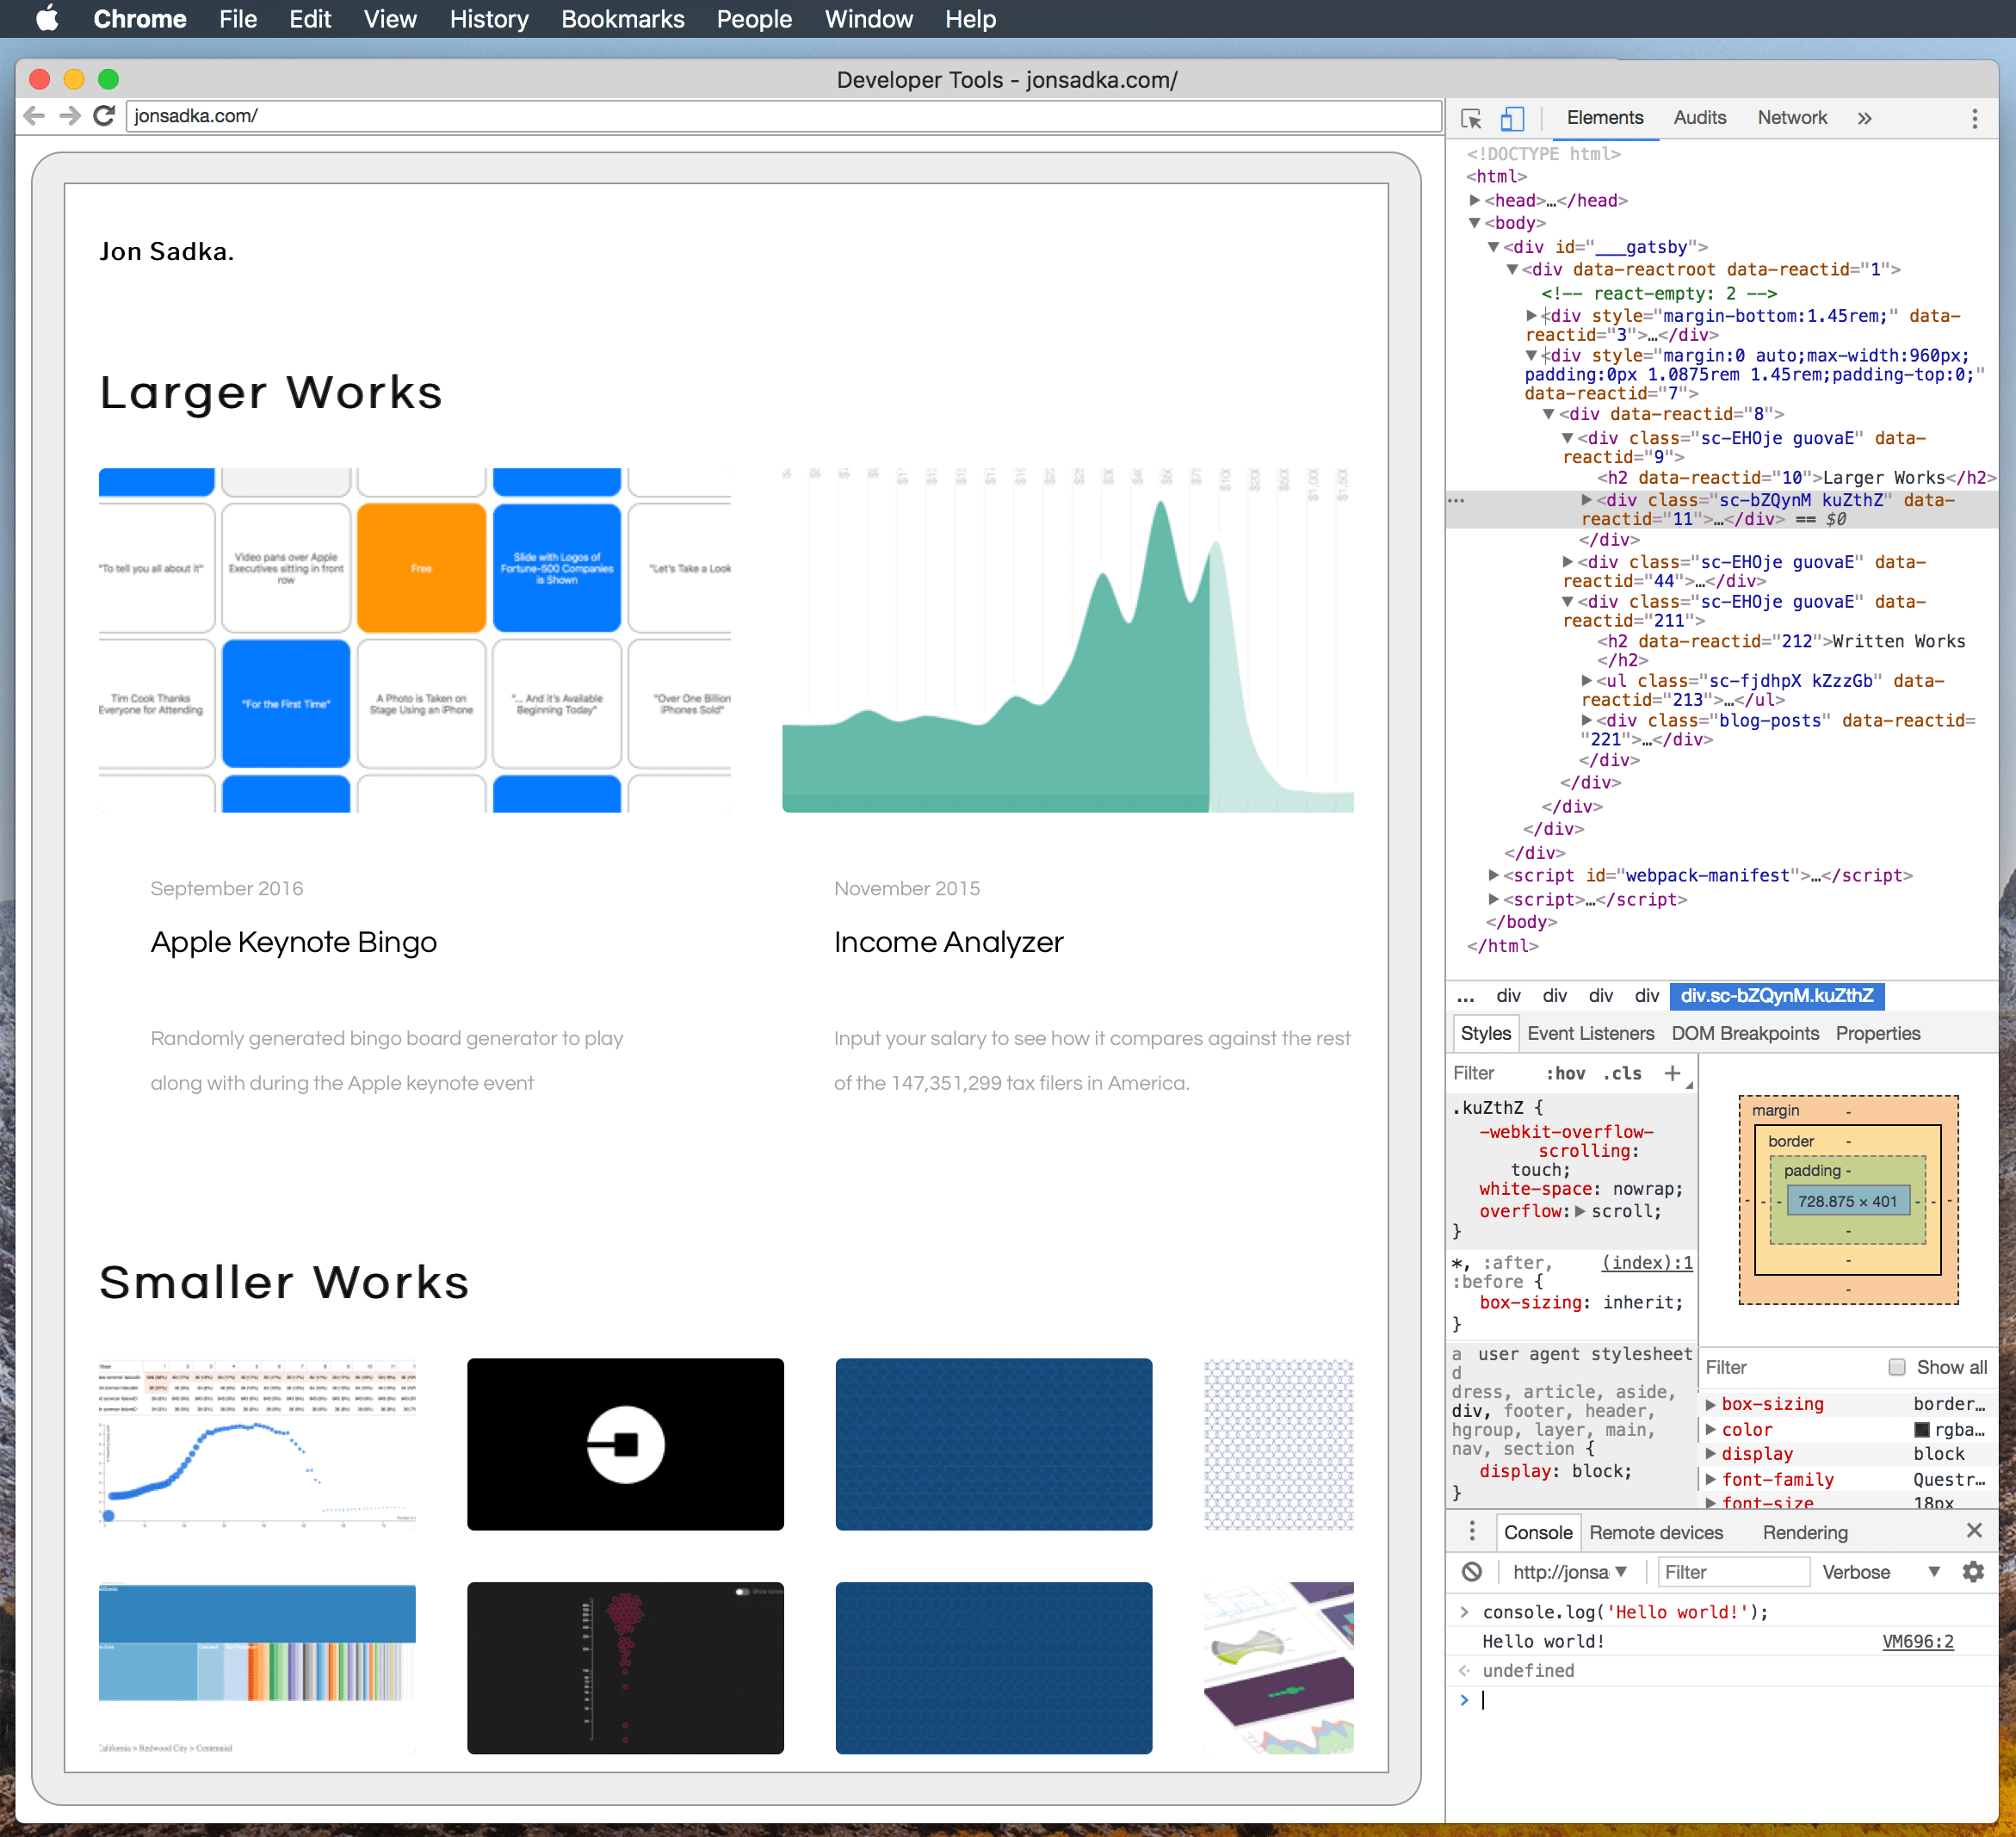
- A Chrome debugger will appear which uses Chrome's context and user agent string instead of Safari's
- Open Chrome on your OSX computer and navigate to