Larger Works


Smaller Works
- All Sources
- Observable
- Bl.ocks


Written Works
- All Tags
- API
- D3.js
- JavaScript
- jQuery
- MongoDB
- UX / UI
How to deploy imgproxy to Google Cloud using Docker and Cloud Run
Goal Be able to host a production instance of imgproxy on Google Cloud within minutes. First time installation Open the Cloud Terminal Follow the Before you begin section listed here (https://cloud.google.com/container-registry/docs/pushing-and…
ReadHow to export Photoshop images at custom resolutions using Adobe Photoshop Scripting and JavaScript
Goal For a recent project, a goal was set to improve page load times on mobile devices. One quick win was to develop images at varying breakpoints and load the smallest viable image using srcset attributes on <image> tags instead of loading the same…
ReadDesigning and engineering the Steel Explorer, a visualization tool for structural engineers to select the most efficient beam
NOTE: New to the Steel Explorer? Read about it here. Welcome The purpose of this post is to highlight things that come to mind when reflecting on my time designing, iterating, and building the Steel Explorer. Some are tips, some are tricks, and some…
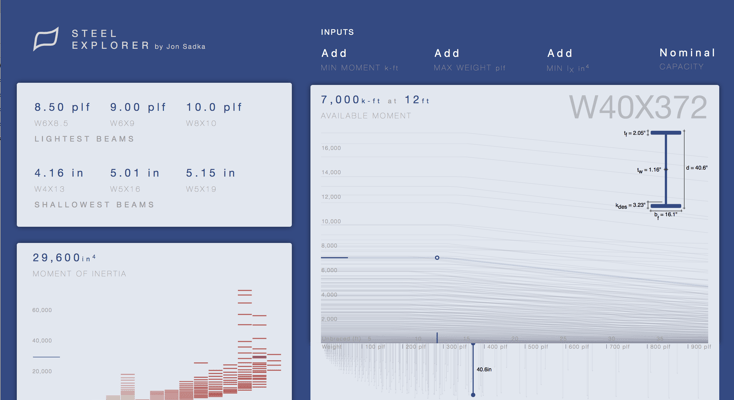
ReadOverview and usage of the Steel Explorer, a visualization tool for sturcutural engineers to select the most efficient beam
NOTE: Curious about design and engineering decisions of the Steel Explorer? Read about them here What is it? Steel Explorer allows Structural Engineers to quickly find the optimal steel beam for their structure in a simple and visually rich way…
ReadHow to create live updating and flexible D3.js line charts using D3.js v5 and pseudo-data (interactive tutorial and example)
One of the bigger challenges in visualizing data is making your charts responsive so that they can resize no matter what range of data is thrown at it. Things get even more complicated when the dataset is actually a collection of many individual sets…
ReadHow to debug an issue in Chrome for iOS using remote debugging
I recently had the opportunity to implement some new visualizations for Uber City Guides. Before launch, we discovered a strange bug that only occurred on Chrome for iOS. Even though there are some helpful guides online on how to debug Chrome…
ReadChoosing the best numbers in nfl football squares to beat your friends
The Super Bowl Square gambling game is all luck, right? Not according to our calculations. An analysis of all 2,312 NFL games since 2009 revealed guessing certain numbers each quarter can increase your chances of winning. Your best bets are 0, 3, and…
ReadHow to generate time series aggregations in MongoDB using Unix / Epoch timestamps (week over week, year over year, etc. tutorial and example)
ECMAScript5 introduced Date.now(), a method that returns the milliseconds elapsed since 1 January 1970 00:00:00 UTC up until now as a Number. Date.now() is the fastest way to record a timestamp in JavaScript[1], [2] and as such, usage will continue…
ReadHow to write data to the beginning of a file with Node.js / JavaScript (tutorial and example)
Recently I have had to do a lot of work building infrastructure converting data from .json to .csv. One challenge that presented itself was figuring out a way to prepend / write data to the beginning of the .csv file. There are plenty of use cases…
ReadHow Apple can catch up to Google ratings and Yelp reviews overnight
Yelp. The word is synonymous with ratings. Although Yelp is very powerful and has millions of reviews, they have not gained my trust. There are tales of paid Yelp reviews, compromised Yelp reviews, even extortion. To use Yelp, I need to stop…
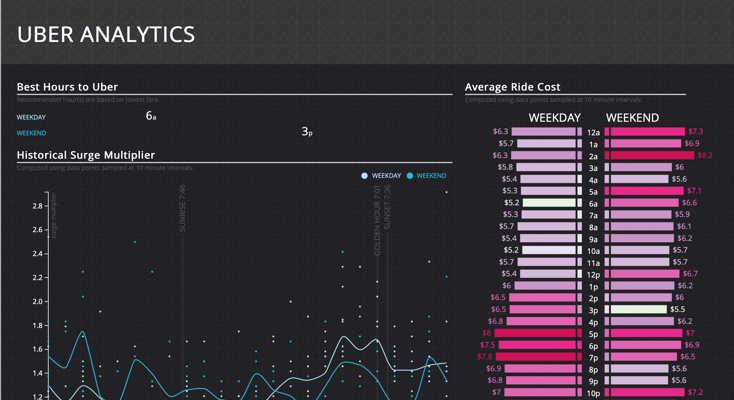
ReadBest and worst times to take an Uber in San Francisco, Los Angeles, and New York
About two months ago, Nicolas and I were curious to see if we could nail down the cheapest and priciest hours to order an Uber. To do this, we requested pricing data from Uber’s developer API at ten minute intervals in three major cities (San…
ReadHow to create adaptive pie donut charts with transitions in D3.js (interactive tutorial and example)
Following up with my last blog post about adaptive line chart graphs (link), I decided to apply this same concept of adaptive charts to a pie / donut chart. The goal is to create a chart similar to the one below, which updates to any new data thrown…
ReadHow to create live updating and flexible D3.js line charts using D3.js v3 and pseudo-data (interactive tutorial and example)
NOTE: Looking for the newest version of this tutorial using the latest version of D3.js (v5)? See it here One of the bigger challenges in visualizing data is making your charts responsive so that they can resize no matter what range of data is thrown…
ReadHow to modify, filter, and save JSON files locally using jQuery
3/19/2015 Update: I went ahead and created a little application to help make things easier which can be found here https://github.com/jonsadka/jsonReducer There are many API’s available for use, many of which are free and provide lots of fun data to…
ReadHow to quickly create randomly generated datasets in JavaScript with D3.js
Often times in JavaScript and D3.js, we want to quickly create randomly-generated, "fake" data on the fly for testing and iterative development. To help speed things up, we can combine the d3.range() operator and the native Array.map() prototype to…
ReadUsing .reduce() to create arrays and objects in JavaScript
I love functional programming and things just got better because of reduce and reduceRight. In ECMAScript5.1, the Ecma integrated some really common array mutation operations from some popular libraries (underscore, lodash, etc.) and made them…
ReadHow to use the Uber API to get pricing data
Uber opened up their API to developer and as a fun experiment, I decided to play around with the Uber API, collect a few days worth of data and see if any trends were apparent (http://jonsadka.github.io/uberAnalytics/). To make a successful pricing…
ReadFight on! The power of JavaScript closures
The term closure is often thrown around a lot in the JavaScript community however there seems to be a misunderstanding of what this term really means. A closure in JavaScript does not refer to a specific function, but rather the way in which that…
ReadPrototypal and pseudoclassical instantiation in JavaScript
In JavaScript, there are four ways to instantiate a new object. This blog post will cover the differences between the prototypal and pseudoclassical instantiation patterns; functional decorator and functional-shared instantiation patterns will not be…
ReadType coercion in D3.js
D3.js is an amazing platform that allows software engineers to bind data to each DOM element that exists, or will be, created. This data can then be used to compile graphs, charts, or any other visual means. Last week, I had the opportunity to play…
ReadSupercharge your falsey && conditional statements in JavaScript
Over the past few days, I have discovered the large potential of falsey values (false, 0, "", null, undefined, NaN) to provide direction and simplify code in javascript. If used correctly, one can replace multi-line logical expressions with logical…
Read